NIFTY ROADMAP ON DOT PREDICTION
Disclaimer : This is not a trading Advice, but are my thoughts / discussions with those who are interested in the useful application of Technical Analysis. While due care has been taken in preparing these notes/comments, no responsibility can be or is assumed for any consequences resulting out of acting on them.Trading in Stocks/Commodities/Futures Carry Risk.Consult your financial advisor / SEBI registered Research Analyst only before you trade.This is not a buy / sell recommendation and no Stocks will be discussed.Only broad market trends are discussed here.
CNX NIFTY 8,565.55 +39.20 + 0.46%
Nifty mimicked the Roadmap exactly as shown yesterday.Also it made a low below 8489 which was given yesterday.
I am hereby reproducing yesterday’s road map first which you can otherwise check on yesterday’s date.Below that I am giving today’s chart.NIFTY exactly replicated sub minuette waves ( iii) -( iv) -( v) and minuette waves iii -iv -v for bigger wave 3
YESTERDAY’S CHART 30 minutes.

TODAY’S CHART 30 minutes

NIFTY TOUCHES TARGET OF 8531
Disclaimer : This is not a trading Advice, but are my thoughts / discussions with those who are interested in the useful application of Technical Analysis. While due care has been taken in preparing these notes/comments, no responsibility can be or is assumed for any consequences resulting out of acting on them.Trading in Stocks/Commodities/Futures Carry Risk.Consult your financial advisor / SEBI registered Research Analyst only before you trade.This is not a buy / sell recommendation and no Stocks will be discussed.Only broad market trends are discussed here.
CNX NIFTY 8,526.35 -134.70 -1.56%
NIFTY touched the projected target of 8531.These targets were continuously mentioned in Feb 1 to 4 newsletters on daily charts ( see daily chart on newsletters).I had not uploaded them since it would have been unfair to my subscribers.Also I have uploaded today’s Newsletter.
Some downward may be left in Nifty upto 8429 to 8484 area or Nifty may have completed the downmove ( see alternate count at the bottom).Whatever it may be, it will be clear after tomorrow’s Delhi election results.
NIFTY 30 mins
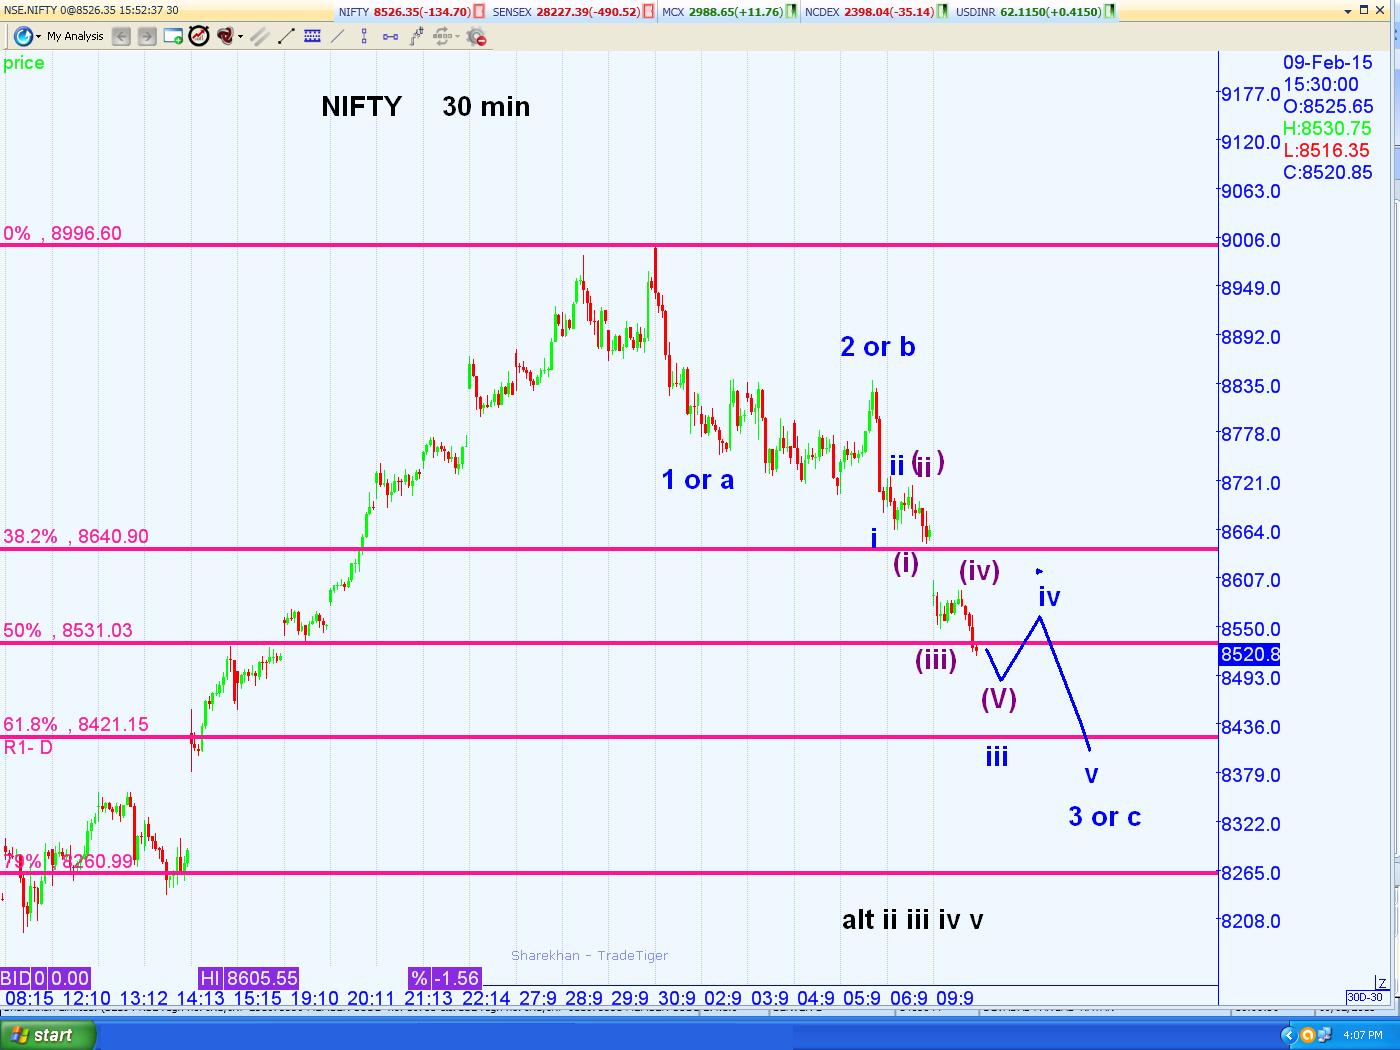
Watch also the alternative count above at the bottom.
CLICK ON LINKS BELOW TO OPEN NEWSLETTERS
NIFTY Trend for February 9 Today’s Newsletter
NIFTY PAST NEWSLETTERS
Disclaimer : This is not a trading Advice, but are my thoughts / discussions with those who are interested in the useful application of Technical Analysis. While due care has been taken in preparing these notes/comments, no responsibility can be or is assumed for any consequences resulting out of acting on them.Trading in Stocks/Commodities/Futures Carry Risk.Consult your financial advisor / SEBI registered Research Analyst only before you trade.This is not a buy / sell recommendation and no Stocks will be discussed.Only broad market trends are discussed here.
Below Is The Chart Which Was Given For Feb 06, and NIFTY Fell 50 points

Click On Links below to see past Newsletters
NIFTY ELLIOTT WAVE DIAGONAL TRIANGLE

Disclaimer : This is not a trading Advice, but are my thoughts / discussions with those who are interested in the useful application of Technical Analysis. While due care has been taken in preparing these notes/comments, no responsibility can be or is assumed for any consequences resulting out of acting on them.Trading in Stocks/Commodities/Futures Carry Risk.Consult your financial advisor / SEBI registered Research Analyst only before you trade.This is not a buy / sell recommendation and no Stocks will be discussed.Only broad market trends are discussed here.
Contact astrologerdevadas@gmail.com or Call 09449923900 for Daily NIFTY newsletter.
ANY IDEA WHY THE MARKET WENT HIGH AND BROKE THE LOW ?
Diagonal Triangles are powerful patterns which occur as 5 th wave or C waves.They are terminating waves that occur at the end of a pattern.The characteristics of diagonal triangle are
1) They are 3- wave structures.
2) They terminate a move.
3) Wave 4 overlaps wave 1 which is not accepted in an impulse pattern but accepted here.
4) They are basically wedges i.e both the lines encompassing them slant in the same direction.
5) MOST IMPORTANTLY The thrust after the completion of the pattern retraces upto their origin completely in 25 to 50 % of the time they took to form.These are very violent and fast patterns.
Today NIFTY did the same .It was forming a C wave diagonal triangle.It took 26 — 30 minute bars to complete the pattern.It retraced upto the origin i.e 8836 in 10 — 30 minute bars i.e in less than 13 bars ( 50 % time).Once this was over, it collapsed.
DIAGONAL TRIANGLE

NIFTY 30 mins

BIG START 460 POINTS PLUS IN 20 DAYS IN NIFTY
Disclaimer : This is not a trading Advice, but are my thoughts / discussions with those who are interested in the useful application of Technical Analysis. While due care has been taken in preparing these notes/comments, no responsibility can be or is assumed for any consequences resulting out of acting on them.Trading in Stocks/Commodities/Futures Carry Risk.Consult your financial advisor / SEBI registered Research Analyst only before you trade.This is not a buy / sell recommendation and no Stocks will be discussed.Only broad market trends are discussed here.

My newsletter had an eventful start.I was able to predict 460 points after deducting a loss of 275 points on the day of RBI rate cut. Chart is self explanatory .
NOTE: I have taken lower figure for profits and maximum points on upper side for loss.i.e loss is shown as maximum as possible, but profit is shown from opening or previous close whichever is disadvantageous to me .Also at some places I have rounded off profits to lower figures.
Point 1 Actually previous day close was 8368 and low next day was 8065 ( Jan 07) which is 400 points, but I have taken from opening of January 06, i.e 8325 to 8123 i.e only 200 points.
Points 2 8123 to 8300 i.e 175 points
Point 3 Said NIFTY will not go above 8366( high was 8355, so 8350 -8265 ( Low was 8236).
Point 4 I had given that wave 3 down may have started, for 15 th January morning.That day RBI had cut 0.25 basis points.So market opened at 8425 (8525-8425) and we lose only 100 points.But to be fair, I have taken from previous day’s close of 8268 (still it is 257 points I have rounded to 275 points).Why I have taken 8525 is because I said that NIFTY is in Bull orbit from that point onwards.
POINT 5 At 8525 had given a long call for targets of 8660, but market went to 8708. (8660-8525 =135 , but I have taken 125 points).This sounds easy as you read but difficult since change in direction is possible for seasoned traders only
Point 6 At 8725 long call given, and 8866 was high on Friday.
Also I learnt a lot in these 20 days.Previously, if I was wrong in a trade I would apply stop and get out and stay neutral.But here I had bigger responsibilities towards my clients.So at 8525, I had said that markets are Bullish ( this was not an arbitrary call but was based on sound technicals).
Also this newsletter is meant for traders who have 3-4 years experience and not for beginers.Personally, I do not have anything against beginers ( I was also one many years back), but you will not be able to understand and trade accordingly.e.g I was bearish at 8350 before RBI rate cut, but was very bullish at 8525 and then at 8715, which is easy to read on this blog, but mentally difficult to trade. If you are a beginer and insist, I may send the newsletter.
Also this is not a newsletter which will give you long and short calls.
Contact me at astrologerdevadas@gmail.com or my mobile at +91 94499 23900 if any problem persists in opening the newsletters.
Newsletters of January 19 th January onwards will not be shown as they contain future targets.They will be uploaded next month.
You can click on the links below and they will open or Keep your mouse pointer on the links below and Right Click and “save target as” or Right click and “open in a new window” or Right click and “open in a new tab” .Preferably use Google Chrome.
Nifty TREND for 2015-01-06

